
TL;DR:
- A warranty cost analysis workflow involves collecting, classifying, and modeling vehicle warranty costs to inform decision-making. Accurate data, proper tools, and regular audits are essential to prevent cost leakage and improve reserve accuracy. Fixing issues at the intake stage and ensuring data normalization are key to maintaining reliable and actionable insights.
A warranty cost analysis workflow is the structured process of identifying, quantifying, and managing every cost tied to vehicle warranties, from the moment a claim is filed through final resolution and financial reporting. For anyone buying or maintaining a vehicle, understanding this process means the difference between a surprise $4,000 transmission bill and a repair you budgeted for months in advance. Whether you own a BMW 5 Series, a Mercedes GLE, or a Ford F-150, the same core workflow applies. This guide walks you through each phase, the tools that support it, and how to turn raw claims data into smarter ownership decisions.
What does a warranty cost analysis workflow require?
An effective warranty cost analysis workflow runs on three inputs: accurate sales records, complete claims data, and documented repair costs. Without all three, your cost models produce numbers that do not reflect reality. Think of it like a triangle. Remove one side and the whole structure collapses.
Key data sources
The data you collect determines the quality of every downstream decision. Sales records establish the population of vehicles under warranty at any given time. Claims data captures what broke, when it broke, and what the repair cost. Repair cost records from dealerships and service centers fill in labor rates, parts prices, and diagnostic fees.
For vehicles like the Range Rover Sport or the Mercedes C-Class, repair costs carry significant weight. A single air suspension failure on a Range Rover can run $1,500 to $2,800 in parts alone. Without granular cost records, your analysis will underestimate exposure on high-end vehicles by a wide margin.
Tools that support the workflow
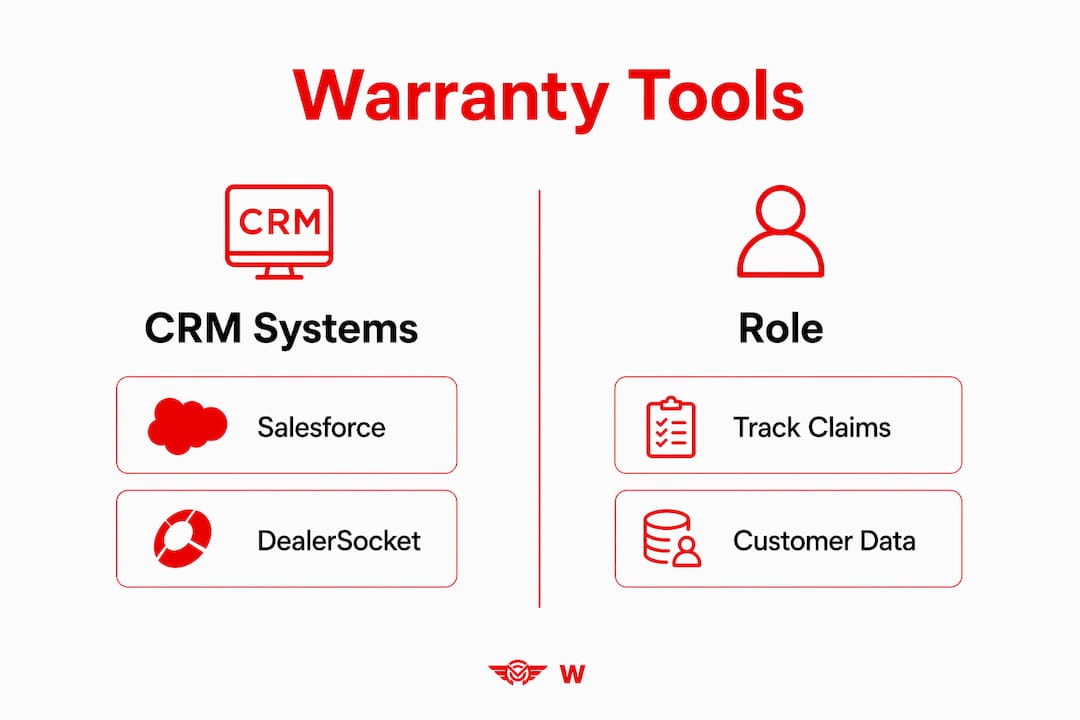
The right tools turn raw data into usable analysis. Below is a summary of the core platforms and their roles in the workflow.

| Tool Category | Example Platforms | Role in Workflow |
|---|---|---|
| CRM Systems | Salesforce, DealerSocket | Track vehicle sales and customer warranty status |
| Warranty Management Software | Tavant Warranty, Mize | Centralize claims intake, triage, and approval |
| Data Integration Platforms | MuleSoft, Informatica | Normalize data across dealerships and suppliers |
| Analytics and Reporting | Tableau, Power BI | Visualize claim trends and cost forecasts |
| Accounting Software | SAP, Oracle Financials | Record warranty liabilities per GAAP standards |
Per GAAP, warranty costs must be accrued as liabilities at the point of sale, reflecting estimated future claims to avoid financial misstatements. This means your accounting tools must connect directly to your claims data, not operate in a separate silo.
Pro Tip: Before selecting a warranty management platform, confirm it supports automated data normalization. Inconsistent repair codes across dealerships are the single most common cause of inaccurate cost models.
Data normalization is not optional. When a Ford dealer in Texas codes a transmission repair differently than a Ford dealer in Ohio, your aggregate analysis produces noise instead of signal. Platforms like Informatica or MuleSoft standardize those codes before they enter your model.
How do you execute each step of the workflow?
The warranty cost analysis process follows six distinct steps. Each step feeds the next, so skipping or rushing any phase compounds errors downstream.
The six core steps
-
Data Collection. Pull sales records, claims submissions, and repair invoices into a central repository. Set a consistent data refresh cadence, weekly at minimum for active fleets.
-
Triage and Prioritization. Sort incoming claims by cost severity, failure type, and vehicle model. High-cost claims on luxury vehicles like the Porsche Cayenne or BMW X5 should move to the front of the queue. Starting with simple clustering on failure descriptions improves triage decisions and early cost recovery by 10–20%. That improvement comes from faster routing of claims to the right analysts.
-
Classification. Assign each claim to a cost category: parts, labor, supplier liability, or goodwill. This classification drives both financial reporting and supplier recovery conversations.
-
Cost Estimation. Calculate the total cost per claim, including parts, labor, diagnostic time, and any sublet repairs. For vehicles with complex electronics like the Mercedes S-Class or BMW 7 Series, diagnostic costs alone can represent 20–30% of total repair cost.
-
Forecasting and Reserve Setting. Use historical claim rates and repair costs to project future warranty expenses. ML-driven forecasting and unified data modeling improves warranty reserve accuracy by 20–30%, aligning reserves better to actual risk. That accuracy gap matters when you are setting aside capital for future repairs.
-
Reporting and Closeout. Produce cost summaries by model, failure type, and time period. The closeout phase transforms operational data into inputs for upcoming reserve estimates and product failure analysis, making it critical for continuous improvement.
Comparing cost modeling approaches
Not every organization needs the same modeling depth. The table below compares three common approaches.
| Modeling Approach | Best For | Accuracy Level | Complexity |
|---|---|---|---|
| Simple Averaging | Small fleets, single model lines | Moderate | Low |
| Regression Analysis | Multi-model portfolios with 2+ years of data | High | Medium |
| ML-Driven Forecasting | Large datasets, mixed vehicle types | Very High | High |
| Life-Cycle Cost Modeling | Total ownership decisions, fleet planning | Very High | High |
Life-cycle warranty cost analysis requires all cost categories from development through disposal to be modeled, which makes it the most defensible approach for governance-based decisions. For an individual buyer comparing a Honda Pilot against a BMW X3, a simplified life-cycle model still outperforms gut instinct by a significant margin.
Pro Tip: If your dataset is under two years old, avoid regression models. They require stable historical patterns to produce reliable forecasts. Start with simple averaging and layer in regression once you have sufficient claim history.
What are the common challenges in automotive warranty workflows?
Warranty workflows fail in predictable places. Knowing where the cracks appear lets you fix them before they cost you money.
Claim leakage
Claim leakage is the most expensive silent problem in warranty management. Between 3–15% of total warranty costs are leakage, where funds are improperly paid, and OEMs lose 2–7% of revenue to warranty claims annually. For a dealership group processing $10 million in warranty claims per year, that leakage range represents $300,000 to $1.5 million in recoverable losses. Most of it goes undetected because no one is auditing claim classifications against actual repair records.
Inaccurate or incomplete data
Garbage in, garbage out. When service advisors enter vague failure descriptions like "customer states noise" instead of specific diagnostic codes, your triage and classification steps break down. This problem is especially common with older vehicle lines where repair documentation standards were less rigorous.
Supplier delays and disputes
When a component failure traces back to a supplier, recovering costs requires documented evidence of the defect, the repair, and the causal link. Delays in supplier responses extend cycle times and inflate carrying costs. Improving warranty triage workflow can reduce cycle times from 18 days down to 6–8 days through process improvements and data normalization. Cutting cycle time by that margin accelerates supplier recovery and reduces the cost of carrying unresolved claims.
Troubleshooting checklist
- Audit claim classifications monthly against actual repair invoices to catch leakage early.
- Require technicians to enter OBD-II fault codes alongside narrative descriptions for every claim.
- Set supplier response deadlines in your warranty agreements and track compliance in your management platform.
- Review your intake forms quarterly. Poorly designed intake forms are the root cause of most data quality problems.
- Run a closeout review after every major model year to capture lessons for the next reserve cycle.
Pro Tip: Effective warranty cost management focuses on fixing the intake phase first. A clean intake process prevents data errors from multiplying through every downstream step. Spend 80% of your improvement effort there before touching your forecasting models.
How do warranty cost insights drive smarter vehicle decisions?
The real value of a warranty cost analysis workflow shows up when you translate numbers into decisions. Raw claim data becomes a tool for budgeting, purchasing, and supplier management.
Total cost of ownership estimates
Total cost of ownership (TCO) is the complete financial picture of owning a vehicle over its useful life. Warranty costs are a significant and often underestimated component of that picture. A BMW 3 Series with a strong factory warranty and low historical claim rates carries a meaningfully different TCO than the same vehicle purchased out of warranty with no extended coverage. When you model warranty costs accurately, you can compare vehicles on a true apples-to-apples basis rather than sticker price alone.
Warranty cost analysis is foundational for pricing strategies, margin management, and make-versus-buy decisions, requiring structured cost categorization. For a fleet manager choosing between a Mercedes Sprinter and a Ford Transit, structured warranty cost data can shift the decision entirely. The vehicle with the lower purchase price may carry higher warranty exposure over a five-year ownership period.
Setting reserves and budgeting
Warranty reserves are the funds set aside to cover future claims. Setting them accurately requires the same forecasting discipline described in the workflow steps above. Under-reserving creates cash flow problems when claims spike. Over-reserving ties up capital that could be deployed elsewhere. The matching principle in accounting requires warranty liabilities to be estimated and recorded at the point of sale, ensuring accurate profit reporting. For individual vehicle owners, this principle translates into a simple practice: estimate your likely repair costs for the next 12 months and hold that amount in a dedicated account.
Extended warranty and supplier decisions
Warranty cost data also informs whether an extended warranty makes financial sense for a specific vehicle. A Porsche Panamera with a documented history of high-cost electronic failures presents a very different risk profile than a Honda CR-V with a clean claims record. When your cost analysis shows that a vehicle's average out-of-warranty repair cost exceeds the price of an extended plan, the math favors coverage. When repair history is clean and parts costs are moderate, self-insuring may be the better call.
Supplier selection follows the same logic. If your data shows that a specific transmission supplier generates three times the claim rate of an alternative, that information belongs in your next procurement conversation. Cost analysis processes that capture supplier-level data give you leverage in negotiations that gut instinct never could.
Key takeaways
A structured warranty cost analysis workflow is the most reliable way to control vehicle ownership costs, recover supplier losses, and make informed purchasing decisions.
| Point | Details |
|---|---|
| Start with clean data intake | Accurate claims data at intake prevents errors from compounding through every downstream step. |
| Use the right modeling tool | Match your forecasting approach to your dataset size; ML models require large, mature datasets to outperform regression. |
| Audit for claim leakage | Between 3–15% of warranty costs are improperly paid; monthly audits recover significant funds. |
| Connect warranty costs to TCO | Warranty expense tracking belongs in every total cost of ownership calculation for vehicle purchases. |
| Closeout phases drive improvement | Reviewing completed claims feeds better reserve estimates and product failure analysis for future cycles. |
Why most warranty workflows break at the same spot
I have reviewed warranty cost processes across dealership groups, fleet operators, and individual vehicle owners for years. The failure point is almost always the same: intake. Not the forecasting model. Not the reporting dashboard. The intake form.
When a service advisor enters "customer complaint: noise" instead of a specific fault code, that vague description flows into triage, classification, cost estimation, and eventually the reserve model. By the time it reaches a financial analyst, the error has been amplified through four or five process steps. Fixing it at that stage costs ten times more than catching it at intake.
The second thing I see consistently is over-investment in modeling complexity before the underlying data is clean. Organizations spend months building ML-driven forecasting tools on top of data that has not been normalized. The model produces precise-looking numbers that are built on a foundation of inconsistent repair codes and missing supplier data. Precision without accuracy is worse than a rough estimate, because it creates false confidence.
My honest recommendation: spend the first 90 days of any workflow improvement effort on intake redesign and data normalization. Only then should you layer in advanced forecasting. The 20–30% improvement in reserve accuracy that unified data modeling delivers only materializes when the underlying data is trustworthy.
The third pattern worth calling out is the neglect of the closeout phase. Most teams treat claim closure as an administrative task. It is actually the most valuable feedback loop in the entire process. Every closed claim is a data point that should inform your next reserve cycle, your next supplier conversation, and your next purchasing decision. Teams that treat closeout as a learning event consistently outperform those that treat it as paperwork.
— Kenneth
Protect your vehicle with the right extended warranty plan
Understanding your warranty cost analysis workflow is only half the equation. The other half is having coverage that holds up when a claim actually hits.
Rpmwarranty offers extended vehicle warranty plans trusted by dealers nationwide, covering engines, transmissions, cooling systems, electrical systems, and high-tech components across a wide range of makes and models. The process is straightforward: consultation, plan selection, customization, and final agreement. Whether you drive a BMW, Mercedes, Range Rover, Ford, or Honda, Rpmwarranty's Elite, Advanced, and Essential plans give you coverage options that match your vehicle and your budget. Get a free quote today and put your cost analysis to work.
FAQ
What is a warranty cost analysis workflow?
A warranty cost analysis workflow is the structured process of collecting, classifying, and modeling all costs associated with vehicle warranty claims, from initial data intake through financial reporting and reserve setting.
How does claim leakage affect warranty costs?
Claim leakage accounts for 3–15% of total warranty costs, representing funds paid improperly due to classification errors or insufficient auditing. Regular monthly audits against repair invoices are the most direct way to recover those losses.
What tools are used in warranty cost analysis?
Warranty management platforms like Tavant Warranty and Mize handle claims intake and triage, while data integration tools like MuleSoft normalize data across locations. Analytics platforms like Tableau and Power BI produce the cost reports that drive decisions.
When does an extended warranty make financial sense?
An extended warranty makes financial sense when your cost analysis shows that a vehicle's projected out-of-warranty repair costs exceed the price of the plan. High-cost vehicles like the Porsche Panamera or Range Rover Sport typically clear that threshold quickly based on historical claims data.
How often should warranty cost models be updated?
Warranty cost models should be updated at minimum quarterly, with a full reserve review at the end of each model year. The closeout phase of each claim cycle provides the updated failure data that keeps forecasts aligned with actual repair trends.